Motivation
I recently found myself asking what antenna radiation take-off angles are important for inter-UK propagation on the LF bands. This requires some understanding of single-hop skywave propagation, which is what I'm going to discuss here.
Maximum single-hop distance
The maximum distance that can be achieved in a single hop isn't so relevant to the question posed, but the geometry is much simpler, and it's useful as a sanity check for the more complex geometry to come.
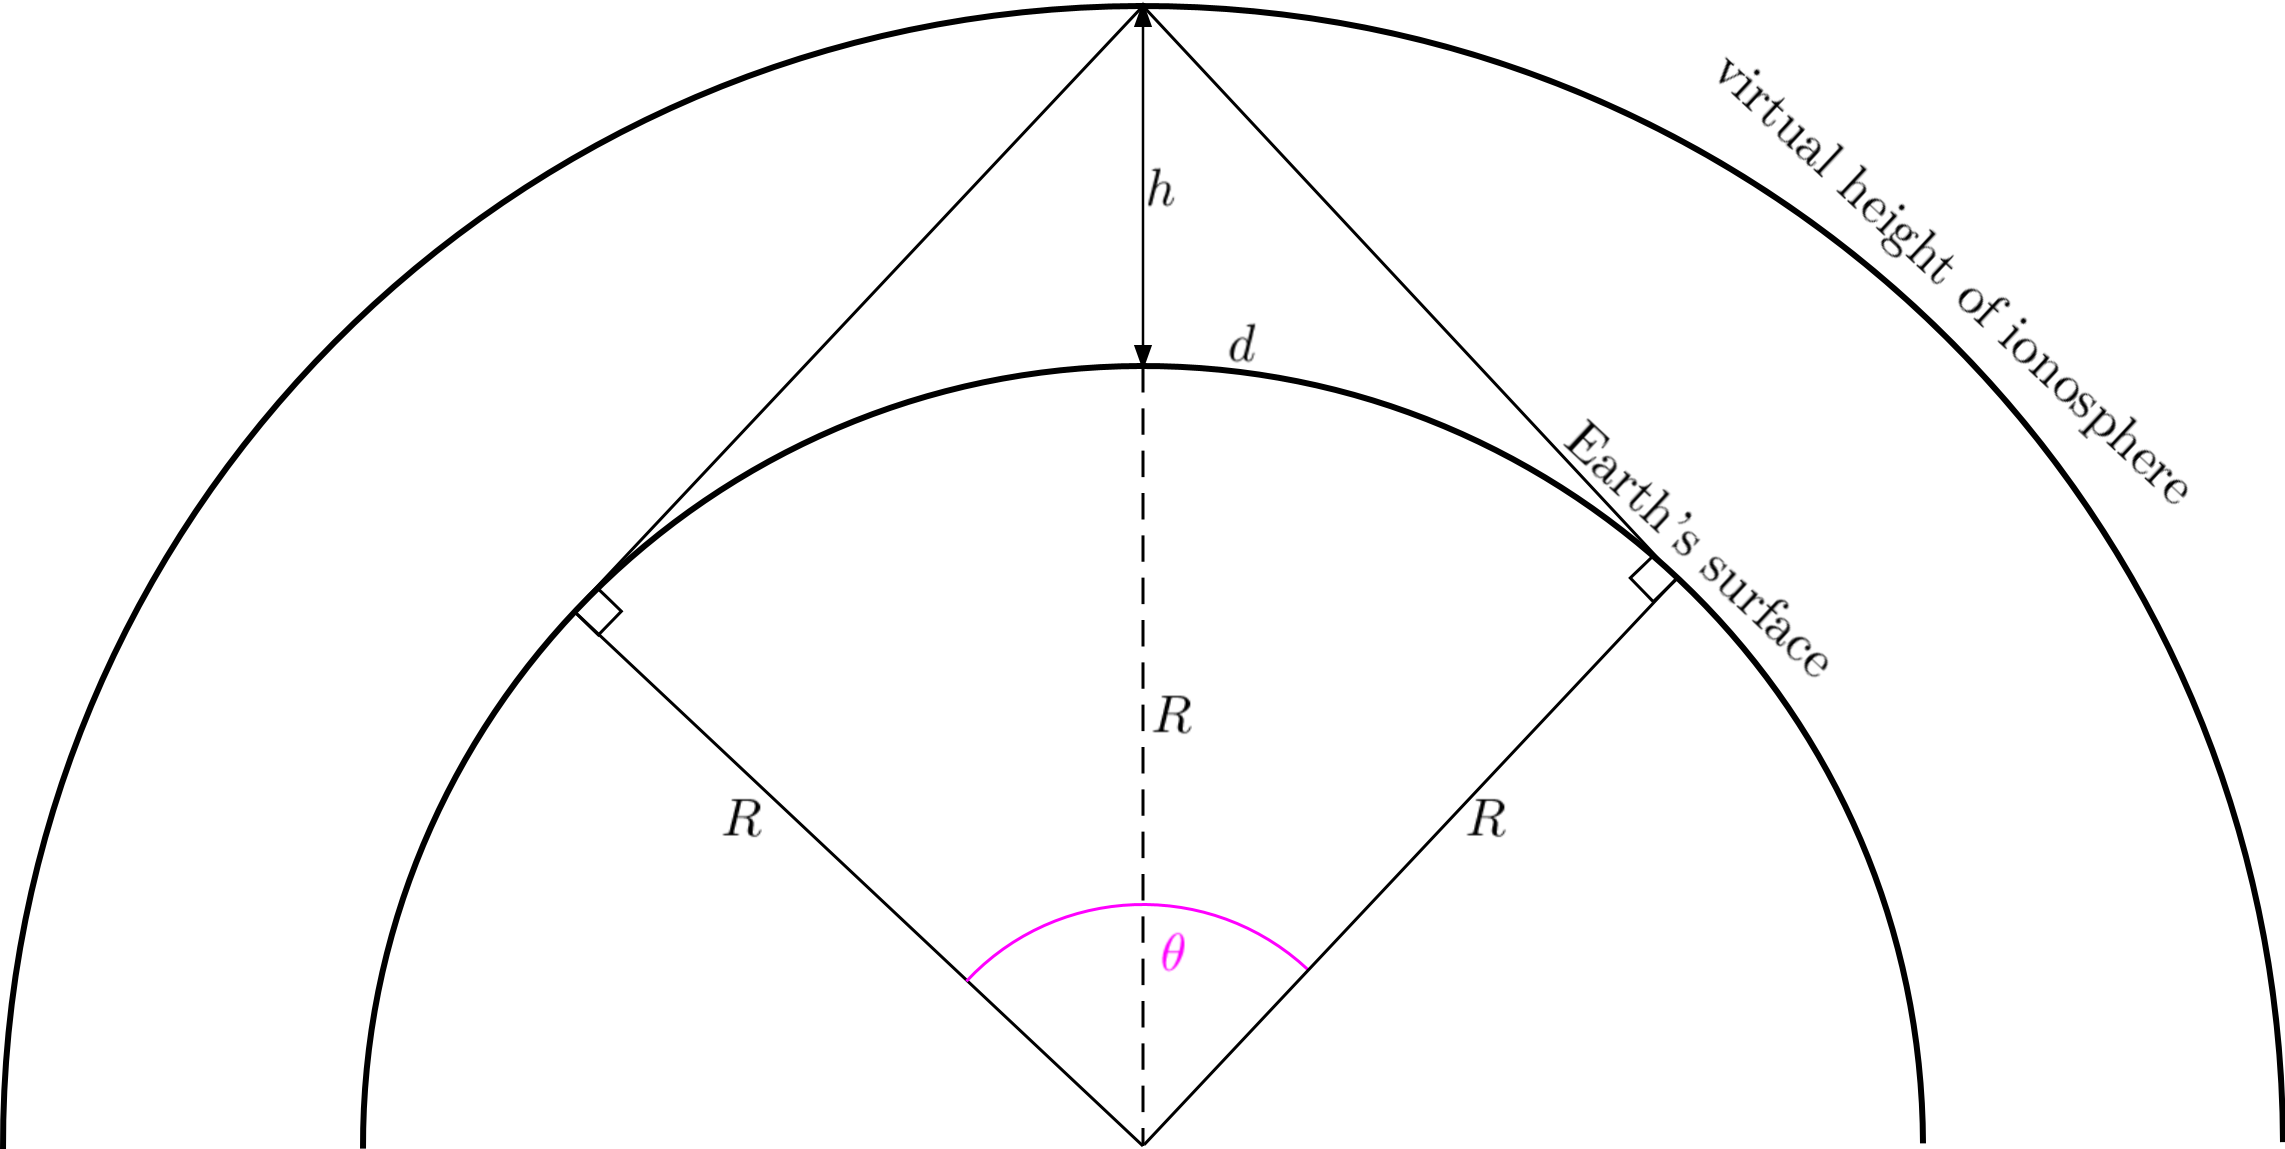
The ionosphere refracts radio waves rather than reflects, but we can still talk about the virtual height (h) of a reflecting ionised layer. By definition, the maximum distance (d) in a single-hop occurs when the transmitting antenna radiates to the horizon and the receive antenna receives from the horizon, i.e. a take-off angle of 0°. This means the radiation and reception is tangential to the surface of the earth, and a right angle is formed with the radial line of length R (the radius of the earth).
If θ is the angle of the sector whose arc is d,
 [1]
[1]
Where θ is in radians.
And since we have a right-angled triangle:
 [2]
[2]
Substituting [1] into [2]:

 [3]
[3]
We'll come back to some typical figures for d later on.
Relating single-hop distance to angle of radiation
Consider the more general case:

An expression for the chord x joining the transmitter and receiver locations may be obtained using the cosine rule:

 [4]
[4]
We can also see that there is a right-angled triangle formed with angle γ, x/2, and h plus some unknown distance between the chord and the arc. We'll call this overall length z. This leads to the expression:
 [5]
[5]
Whilst we don't know z, we do know that the total vertical length from the centre of the Earth to the virtual ionospheric height is R + h, which leads to an expression involving y:
 [6]
[6]
Finally, we need an expression for y in terms of R and θ, which is obtained from either of the lower right angle triangles:

 [7]
[7]
Substituting [7] into [6], we have:
 [8]
[8]
Substituting [8] and [4] into [5], we have:

Therefore:
 [9]
[9]
However, we wanted angle α, rather than γ. Since the interior angles of any triangle must sum to 180° (switching to degrees rather than radians for a moment):

But also (referring to the figure):

So it's easy to work out that:

And since:

We can rewrite [9] in terms of α:
 [10]
[10]
At this point we could substitute for θ using [1], as we did before, but first let's make use of these standard trig identities...


... to simplify the denominator to:

This allows [10] to be simplified to:

Now we can substitute using [1]:
 [11]
[11]
If you want to be fancy, you can use the inverse trig functions:

Verifying the equations
Equations [3] and [11] were used in a simple Octave script, which may be downloaded here:
You can try your own values of h.
In the meantime, I found that Laporte (Radio Antenna Engineering, McGraw-Hill 1952 - now out of copyright) has the type of plot I was interested in, and I've reproduced it below:
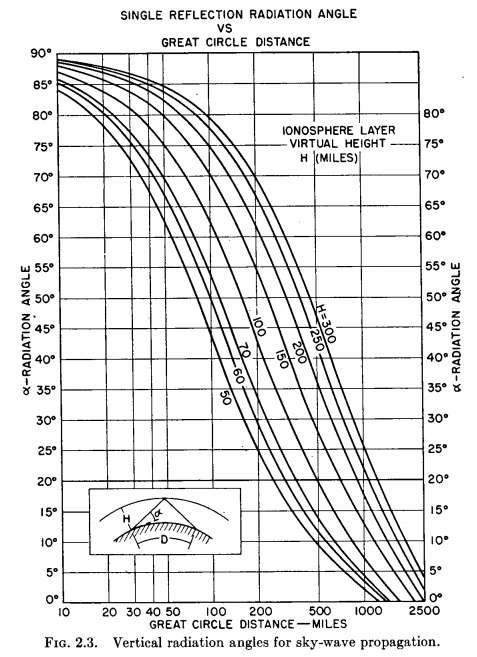
Making my script create a plot in units of miles as well as km, and setting h to 300 miles, I should get the uppermost curve:
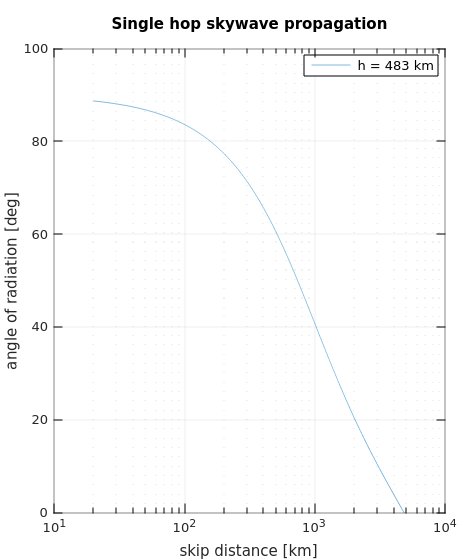
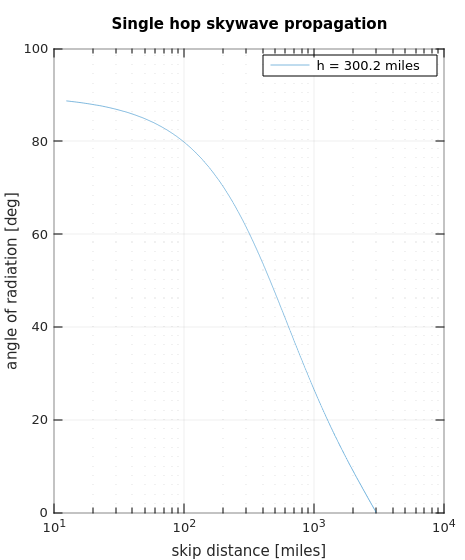
Which I do. Additionally, the script shows that the distance where α = 0 exactly matches the result obtained from equation [3]. Laporte doesn't give the equation that his curves were obtained from, so the equations I've derived may be useful to others.
Typical ionospheric virtual height values
I now need to know what sort of values for h are typical for the frequencies of interest.
The ionosphere is divided into four broad regions/layers as defined here:
- D-Region
- ~75-95km
- Forms during daytime and absorbs low-frequency radio waves.
- E-Region
- ~95-150km
- F-Region
- >~150km
- Splits into two distinct layers (F1 & F2, F2 being the higher region) during the daytime.
- Higher frequencies are absorbed less by the D-region and can make it through to the F2 layer during daytime. This enables the world-wide coverage hams enjoy on the higher HF bands. However, beyond the F2 critical frequency radio waves are no longer reflected, so there is a 'sweet spot'. Greater ionisation from the sun increases the F2 critical frequency.
- Topside
- Basically, the point beyond which there is insignificant ionisation.
Note these are actual heights as opposed to virtual heights. The reason there are separately characterised regions is because radio waves 'reflect' from different virtual heights dependent on frequency. In fact, these heights can be measured in real time using a sounding technique akin to radar, called an 'ionosonde'. Data from an ionosonde is used to generate an 'ionogram', which can tell us at a glance the state of the ionosphere. An explanatory sample ionogram is shown below (Source: Wikimedia Commons):
Each red dot is an individual sounding. If the soundings went below 1MHz you would see these dots level-out around 100km virtual height (y-axis). In fact, this is the E-region, and the numeric data on the left shows the mean height to be 104.7km. As the frequency is increased, the electromagnetic wave has too much energy to be reflected by the E-region. The effect is gradual because in reality we have refraction rather than reflection, and the wave is still slowed-down by the ionisation, making the virtual height appear to increase before we start to see the F-region. The E critical frequency (foE), is the frequency of the vertical line that may be drawn as the asymptote of this upward curve, multiplied by a scale factor. Here we see it is 1.88MHz. This ionogram was taken at night, so there is only one F-region.
Real time ionograms from various locations around the world may be found here:
https://ulcar.uml.edu/WatchIt/latestIonograms.html
Since I'm in the UK, the Chilton ionosonde is of most interest. I've embedded a link to the latest ionogram below (you may need to refresh your browser using F5):
The height of the E and F layers vary seasonally as well as by time of day (diurnal). Generally, all regions experience higher ionisation when they get more sun, and when the solar flux is higher, so the solar cycle will also have an influence. Higher D-layer ionisation leads to increased absorption of low-frequency radio waves, so 160m & 80m in particular perform best at night in the winter months at solar minimum. It's possible to freely obtain historical ionogram data from any of the ionosondes, but you have to register to access the database. I haven't yet done this. In the meantime, I'll use some best estimates.
Typical maximum ground wave distance decreases with increasing frequency. From this reference:
- 160m : ~150km
- 80m: ~100km
Although later on he reckons that more likely the ground wave distance is limited to about 50 miles or about 80km. We are therefore interested in skywave skip distances beyond this figure.
Let's consider the range of E-layer virtual heights on 160m, using the Octave script:
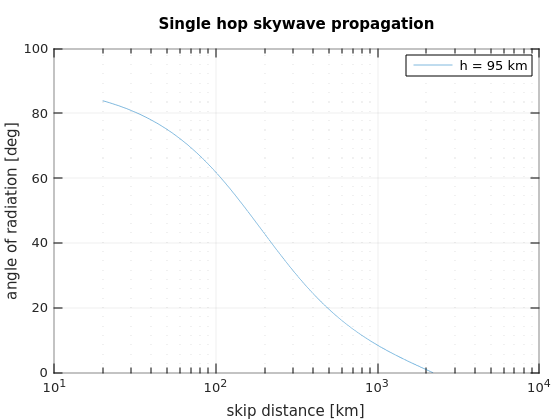
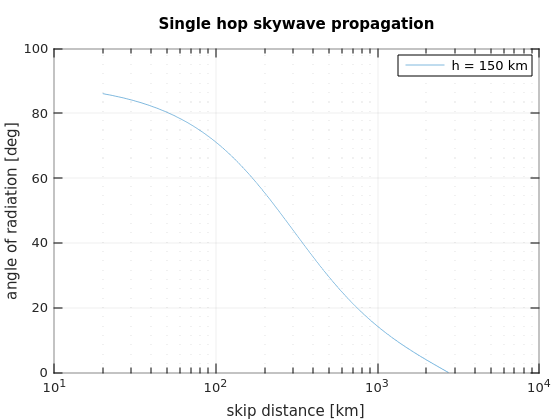
The largest inter-UK distance from Cambridge might be to Lerwick, for example, which has a great circle distance of 890km. These plots show that you would need a take-off angle of 3.7° for a height of 95km, and 16° for a height of 150km. Furthermore, if we only need skywave propagation beyond the 80km ground wave distance, this requires take-off angles of 67° and 74° respectively. For reference, 80km is equivalent to the distance between Cambridge and the centre of London.
This is a little bit surprising, because most people will tell you a low horizontal antenna is better than a vertical on 160m for inter-UK working. Maybe the ground wave distance has been over-egged, but it does imply that vertical antennas may not be as useless for inter-UK working as I had once believed.
I don't (yet) have any ranges for F-layer height on 80m, but let's assume 250km for now and recompute the curve:
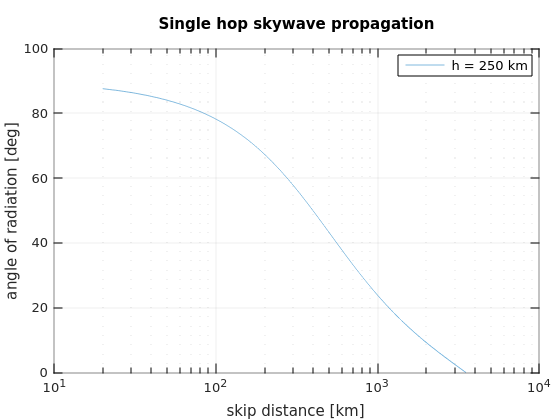
Cambridge to Lerwick requires a take-off angle of 26°, and we need skywave to help us beyond 80km which occurs at 80°. This is much more 'low dipole' territory.
Maybe there's more to this than simple geometry can explain, but it does seem irrefutable that takeoff angles need to be lower on 160m compared to 80m for inter-UK working. I had previously assumed that it was even more important to use a dipole for inter-UK working on 160m than on 80m. The reverse seems to be true.


